|
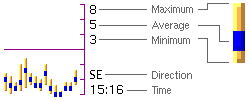
Each
bar in the graph represents a 15 minute
interval.

You
may have to hold down the Shift key (Netscape)
or Control key (Internet Explorer) when
reloading the page to ensure you don't get
a cached copy.
The graphs show windspeed from 0 to 30 knots,
the darkest horizontal axis represents 15
knots.
The
numbers to the right of the graph are the
maximum and average from the most recent
reading. Click on the graphs to get a longer
period.
|

